- News and Stories
- Blog post
- Summit
Metrics that Matter
In order to improve government, we need data. It’s the cornerstone of any solution—because after all, we can’t fix something if we don’t know that it’s broken. Collecting data on government services gives us the chance to see who programs are serving, the impact those programs are making, and where they may be missing the mark. But how do we decide what data to collect, and how do we use that data to improve equity and make government services easier to access?
At the 2021 Summit, a panel of speakers in the government and civic tech fields wrestled with the question: how do we measure what matters?
Oftentimes, what we see governments measuring is really program administration, transactional data, checkboxes...we're missing the boat in terms of continuous quality improvement and really understanding what it is that our programs are achieving and where they're missing the mark.
Speakers talked about the need to embed equity into our data collection and analysis practices, to center individuals and see the real people behind the numbers, to act intentionally once measurements are collected, and to use data to inform outreach strategies that bring in the people who stand the most to benefit from government services.
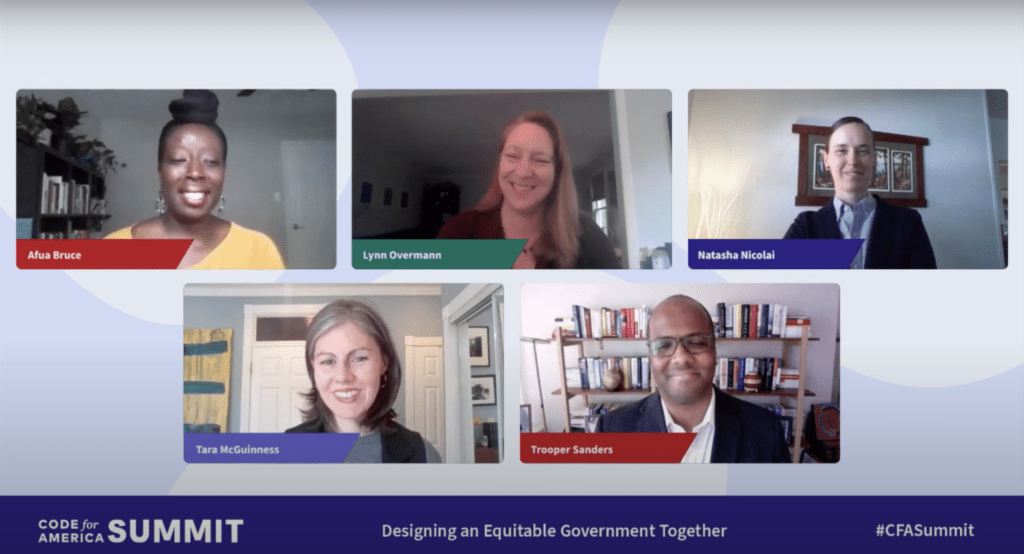
The panel was moderated by Afua Bruce, Chief Program Officer of DataKind, and includes Natasha Nicolai, Chief Data Stratest and Deputy Director of the California Department of Social Services; Lynn Overmann, Senior Advisor for Data and Technology at the U.S. Department of Agriculture; Tara McGuinness, Fellow and Senior Advisor at the New Practice Lab of New America Public Interest Technology; and Trooper Sanders, Chief Executive Officer of Benefits Data Trust.
Afua Bruce: Thank you so much for that introduction. I am so excited to be here today with these panelists really talking about data that is available in government systems and how we can use it to measure what matters. Let’s start at the simplest level. Lynn, I’ll start with you. When it comes to government service delivery, what should we be measuring?
Lynn Overmann: I would love to start with what I think hopefully our goal would be, which is that everyone who is eligible for any government program or service that is intended to help them can easily access it, and then that service helps improve their lives. I think that’s the goal that we all have and in a dream state, I think that would require a certain number of measures that I’ll just tick off quickly.
One, we need to know who our eligible recipients are, what is the universe of people who are eligible for our programs? How are we currently trying to reach those people? Is that outreach effective? Should we be improving there? What are the pain points in our process? Making sure that someone knows that a program or service is available to them does not necessarily mean that they can easily access it.
What are the pain points that are keeping people from accessing those services? Where are people falling out in the process? We tend to create fairly lengthy processes that require a lot of proof. Who’s coming in, how far are they getting, where are they falling out of the process, and what can we learn from that so that we can improve accessibility. Actually, just joining USDA in the past two months in the Biden administration, retention is one that has come to the fore, I wasn’t really that aware of prior to this job.
We have a lot of re-verification requirements in many of the programs at USDA. Are people leaving the program because their life circumstances have improved or they’re leaving the program because the ongoing verification is really burdensome? Those are, I would say, key program measures. The other thing that we also really need to understand is what are the impacts of these programs and services?
If we’re thinking about delivering them more effectively, what is the story that we can tell about the long-term outcomes or the people who participate in our programs both individually, but also across a variety of safety net benefits? Are they having better health outcomes? Are they having better education outcomes? Are they achieving housing stability? What does that mean over the long term? In a dream state, we would be able to easily measure all of those things and adjust our programs accordingly.
Afua: I am a huge fan of your dream state, Lynn, and where we can really see all of the different pieces throughout the entire life cycle of a program, pull out the right data, and then make decisions accordingly. Natasha, still on the flip side, I want to ask you what is government measuring today, and where are we seeing incremental improvement?
Natasha Nicolai: Sure. Thanks for the question. To follow onto Lynn’s point here, oftentimes, what we see governments measuring is really program administration, transaction, and transactional data, checkboxes. Sometimes if we’re lucky, actual process or at the most basic level of engagement but certainly very rarely outcomes. We often see that we’re missing the boat in terms of continuous quality improvement and really understanding what it is that our programs are achieving and where they’re missing the mark.
I would take it even one step further and say that oftentimes, outcomes are not even sufficient, we need outcomes that are also informed by process, and to all those other points around re-verifications or points where people might be falling off in the program, we need to understand that too. It’s not enough to just get to outcomes because oftentimes if we don’t know what led to those outcomes, it’s difficult to take that continuous quality improvement approach.
In my dream state, we have administrative data systems that are more user-friendly, that are easier for both the client and the worker who’s trying to serve them, and that those data are really leveraged in output mentalities to lead to the outcomes and to understand what outcomes we’re achieving and when we are. I know here in California, we’ve been working on creating this iterative data framework, and boy, has it taken some time.
It’s taken a lot of stakeholder engagement, a lot of understanding what’s in our sandbox, what are our parameters that we’re trying to work with them, and how can we help everyone that touches that system to see where our policies are working for us and where they’re not. What’s in scope for us to touch and what levers do we want to be able to pull and what’s not.
It’s been really interesting to try to navigate that landscape and to work backwards really from those outcomes in a logic model to understand what it is that we expect from our clients, what it is that we expect from our government workers so that we can start to build that actual relationship with our participants.
I think today, we get very focused on that transaction, and historically, the government was very interested in some ways in keeping people out of programs and so they created a lot of hoops, and we forgot to focus on the outcome piece and that relationship piece. Ideally, our systems would be better serving people in that relational aspect in that engagement.
Afua: I really appreciated what you had to say there about being intentional about what’s in scope and out of scope, and then of course, how the system actually enables our relationship with the clients and the people who interact with it. Tara, now that we’ve heard a bit about what should be measured and what we are measuring today, can you talk to me about any areas that could serve as a model?
Tara McGuinness: Yes. Those remarks from Natasha really resonated with me, the ability to shift towards access, what are you really– what is the aim of data for what? I think an incredible example of that can be found in the work that Built For Zero Community Solutions, this is a nonprofit that works collaboratively on getting to zero, setting an audacious database goal for homelessness.
They’re a partner to nearly 75 communities across the globe. For me, it’s a real model of what would good looks like when you’re doing this work. We talk a little bit about this in a book I’ve written with Hana Schank called Power to the Public. We tell the story about one particular town, Rockford, Illinois, that’s using a method of data that Community Solutions does in dozens of communities, basically has a few key components.
They make a by-name list of the folks who are homeless in a community. In Rockford, that was over 100 people, and instead of having different systems telling them the rate of homelessness, or who was in the hospital, or who’s showing up in the shelter, they really worked to create data that sees the whole people. They have good controls over how you do that in a way that respects privacy, but they also really understand that one person’s challenge with being housed is not the same as the 100th person, so they create a by-name list.
To just create a list like that requires bringing a bunch of local agencies together sitting around the table. It’s data where people have one little part about a shelter bed or an emergency room, but in order to create this data, there is a community process that has to undergo. They also work at a federal level that collect lots of data on the unhoused. We have a once annual point-in-time count that doesn’t really help you if you’re on the ground in Rockford to understand what you need. I think it’s a really great example of how real-time action at the local level is modeling something that could be thinking about federally.
The ability to have the data that allows them to see in real-time, whether interventions they’re using at work is mission-critical, and has allowed them in Rockford get to zero in two categories of homelessness. I think it’s an inspiration, it’s data-dependent, but it isn’t simply big data, it’s about really understanding the individuals and doing some hands-on engagement with the folks that they’re serving. It’s a great model.
Afua: Thanks for sharing Tara. I think that point about it’s not just about big data, it’s about the individuals that are ultimately being served, I think that’s such an excellent point. Trooper, I’m going to shift the conversation a little bit to talk a bit about accessibility. I’m wondering if you can talk to us a little bit about how does better measurement help us learn who is signing up for programs and why.
Trooper Sanders: Sure. First of all, thank you for inviting me to participate. Second, I think it’s really important to pick up on what Natasha said. It’s really looking at this about the relationship and the experience that people are dealing with. I think data can one, help us find folks who are most likely outside of the circle of benefits to bring them in, so we’re a big fan of data matching and finding people who may be on one benefit, but not receiving another that’s pretty adjacent to be able to target our resources and support.
I think using the data to understand, okay, they’re now in, have received the benefit or have been screened forward, and to really understand what flipped the knob on this, was it the language that was used in a particular piece of outreach, both the language people choose to work in, and then how you’re using the language? Was it the method? Was it a phone call? Was it a letter? Was it texting, and really how to sharpen the approach on that? Also really looking at the broader ecosystem.
We have looked at, for example, our work in Philadelphia and have found that to reach some communities of color, working with community-based organizations who are trusted and who have a respected name in the community works better than other methods. Finally, I think I should say that it’s really important to be intentional about the questions that are being asked and the data that is being collected, and so we’re interested in addressing things such as racial equity or addressing regional disparities or other things, the data that it’s not only collected but how we design the questions that we are asking in the studies are also important.
Afua: Thanks so much for sharing, Trooper. I think your points about data matching, and then really being intentional about what we’re measuring, what impact we’re having are so true. Natasha, I’m going to turn it back to you. Some of the points you raised earlier have been cited a couple of times already in the discussion. Can you talk a little bit about whether this better measurement enables us to better target outreach programs to increase signups from eligible individuals and families?
Natasha: Thanks so much, and I totally want to echo here, the local example that Tara raised and some of the points that Trooper just made. Place matters oftentimes, and leveraging measurement and technology to help us get to an understanding of where there are gaps, and what that analysis should look like at the local level is really critical.
One of my big efforts right now in California is GIS mapping services across the state and tying those services back to localities, and county welfare departments, and the people that we’re trying to serve, using federal, national databases to align with zip codes, and poverty measures and working with our university partners to understand where people are and what our reach index looks like. Where are we serving people? Where is there a clear gap where we should be serving people, where the service is available, where the service is not available. Ton that we can be doing here with technology, I think and with data, if we’re measuring the right things, and looking at the right things to target that outreach.
Another point I would echo that Trooper made there is that we’re also working on having integrated data systems across the state of California that allow for easier eligibility determination, and verification. To his point, if you’re eligible for one program, it’s incredibly likely that you’re eligible for another program, and yet we make you jump through three more hoops to get to that program when it’s the same data elements. We should be very targeted in the data that we’re collecting and measuring. We should be aligning that on behalf of the participants at the state level and then reaching out to them to make sure they know they’re eligible.
Automating that process to decreasing the bandwidth tax. A number of people are coming to us and asking for help, and oftentimes, they wouldn’t if they didn’t need it. That means they’re experiencing scarcity, and that they’re experiencing some level of bandwidth pack and it’s on us as good governments to serve them to step in, decrease that bandwidth tax to collect very specific data elements. Then to avoid making them share those same data elements over and over again, with other programs. We should absolutely be leveraging technology to get those systems consolidated, and to get that eligibility and verification, elevated in a single experience for that client and participant.
Afua: Thanks so much, Natasha, I think especially your point about identifying where there’s a gap in services is really important. Lynn, I’m going to turn it to you to talk a little bit about the importance in equity in all of the work that we do. Measuring for equity seems difficult. How do you think about solving this challenge?
Lynn: Yes, so I think I have more questions than answers, I will start with that. I also just want to kind of pick up a little bit on what Trooper and Natasha just talked about, particularly, Trooper’s point around outreach, credible messengers, and figuring out the best ways to help people access. One of the things that we’ve learned during the pandemic, USDA provided a waiver opportunity for states to waive in-person interview requirements.
What we learned, it was interesting, we thought that that in and of itself, but a lot of people just wouldn’t want to do in-person interviews, a lot of them shifted to telephone. What we’ve heard is that for some clients, actually talking to somebody on the phone at the agency and that person walking them through so much more quickly than otherwise. I think as much as we fall back on data, I think it is really critical to this being open to a range of different ways of doing outreach, helping people feel comfortable in the application process that might look very low tech, but will actually achieve our same goals. I think that is actually a core equity measure, which is, how are we helping being agnostic from a data and technology perspective as to how we’re helping people access.
We want to measure using data and technology, but I think there’s a lot of different ways that we can help people get into our programs. On the equity frontage, a really interesting thing coming from– So I’m new to USDA, as I mentioned, I’m going to shift a lot of people think about USDA, they think about SNAP or our food stamps, they think about WIC. We have massive other programs and one I’m going to highlight one in particular, that has been a consistent equity problem for us. We’ll tell you one of the reasons why we were finding it challenging, that we’re anticipating a fair amount of challenges in determining equity measures.
We have a farm services agency that has about 100-year history of discriminating against farmers of color. When we’re looking at our measures, we have to take into account the fact that we have had people who have been affirmatively turned away from our programs, so who are not in our data. We make a lot of our funding decisions based on things like farm acreage. When you have a 100-year history of farmers losing their farms because of some of our funding decisions, we really have to rethink the way that we are assessing equity, we can’t count on the data that we have in our system right now because that is excluding thousands and thousands of people who are not in our system, because we’ve kept them out of it.
That hopefully is a unique challenge for our agency that we’re absolutely tackling. One thing that we are doing at USDA is we’re doing a racial equity data assessment, which is just a baseline measure of what do we currently know about across all of our programs and services? Who are we serving? What do we know about their demographics? What do we know about their program participation and enrollment?
We’re certainly going to be identifying gaps. We know that some of our programs have better demographic data than others, but at least for us starting to establish a baseline of what we know, and then part of it inevitably is we’re going to need more data than we currently have. I think that baseline is critical. What we’re really interested in and this is, frankly, more of an ask for help than an assertion that we know what we’re doing.
How do you measure equity? Is it parity? Do we want to get all demographic groups equivalent to each other? Are we addressing historic discrimination in our programs? Are we addressing systemic racism? I think we can really add, we’re in a place where we’re prepared to set audacious goals, to increase access to our programs, to increase equity in all of our funding.
I would throw in procurement and contracting, particularly for USDA because we purchase hundreds of billions of dollars of goods every year. We need help setting those goals, and we need help measuring them. I have not and I’m hoping that somebody on this panel can help us to answer that or can point us to the right resources to do so, but we do want to get that right. We think starting from a baseline of at least understanding the current interactions, recognizing our programs, where we’re going to have these gaps because of past practices, is a good starting point.
Afua: Thanks so much for sharing, Lynn. It sounds like you started some really important and hard to implement work at USDA. I’m really excited to see what comes out of that, what baseline you said, and then how you make that impact of measuring for equity and defining what that looks like can be difficult, but it is absolutely necessary if we are actually going to be able to measure what matters and to make sure that we are creating systems. We’re creating a government that really delivers for all people. Trooper, I’m going to turn to you quickly and ask, how does measurement help us iterate and improve programs over time?
Trooper: Yes, well, I think, you know, almost by definition what we’re talking about of a more equal and equitable and accessible public benefits system isn’t going to happen overnight, and by definition, it’s about iteration. I think there are a couple of things. I think one on the quantitative side, we can glean insight that can help us fiddle with the knobs and levers here and there to make some of the adjustments. As a former social science graduate, I also want to put a pitch in for qualitative data and measurements.
One of the most fascinating people in the machine learning space that I know is actually an anthropologist who does a lot of the sort of human and community work that surrounds these things. I think we can really glean insights from people and families by talking to them, by asking them. I think one of the pieces around equity, it’s going to be in the eye of the holder and in the communities, and do they have the experience? That is dignified, that is easy, and that is relevant.
I think from mixing both the quantitative and qualitative, we can figure out what are some of the big leadership decisions and policy decisions that we need to make. Also some of the administrative tweaks that are required. At BDT we spent a lot of time really trying to talk to people on the front and back end and really make those adjustments to not be perfect, but I’m in Philadelphia, we’re trying to be more perfect and do the best we can.
Afua: Thanks so much. Natasha, quickly we’ve talked about so much on this panel today, from equity to iteration to accessibility and measurement, but where are we missing the mark when it comes to measuring the things that matter?
Natasha: Now, thanks so much. Super quick here. I think number one that Lynn pointed out is we have to remember that inequities are often baked into data biases, or data life cycles, historically have by design, collected information that’s insufficient for us to answer a really important questions today, getting equity back in the data somehow and getting that community involvement, as Trooper just said, super important.
And another point that Trooper made, I think is making sure that we capture the hard-to-capture things. If you’re a tech firm out there, and you want a problem to solve, how do we measure the things that we know matter that underlie poverty, disruption, things like executive function, self-regulation, taking a more whole family-focused approach? How do we figure out those two generational models and understand something about the parents and the kids together?
Getting whole generations of family involved in our programs is really important and very, very difficult to measure. When it comes to looking for solutions, I think, and we try to leverage AI and machine learning and things like that, we’ve got to find ways to get away from the equity biases that are baked into our data and we have to find ways to capture those really hard to measure outcomes that are so important to making sure that our services are really hitting the right mark in terms of meeting families from there.
Afua: Great, thanks so much. Thank you again, so much to all the panelists today, I think, from Lynn talking about the importance of doing the hard work to make sure that we embed equity into our data, into our systems, and into our measurement regardless of the history of an organization. Tara talking about the importance of individuals in place that they really matter when you’re looking at data sets. Natasha of course, sharing about the importance of strategically outreaching and being intentional in what we do and Trooper pf course, talking about the intentionality with which we must approach data and systems in increasing access and outreach to people who need to take advantage of certain systems.
Thank you all for your continued efforts in this space and such a great conversation today on measuring what matters.